 Project Timeline
← Back to the app
Project Timeline
← Back to the app
Gantt chart to PowerPoint, without the blur
Free · opens in your browser · no sign-up
Last updated
A Gantt chart usually reaches a slide as a screenshot: soft on a projector, impossible to edit, and wrong the moment a date moves. It does not have to.
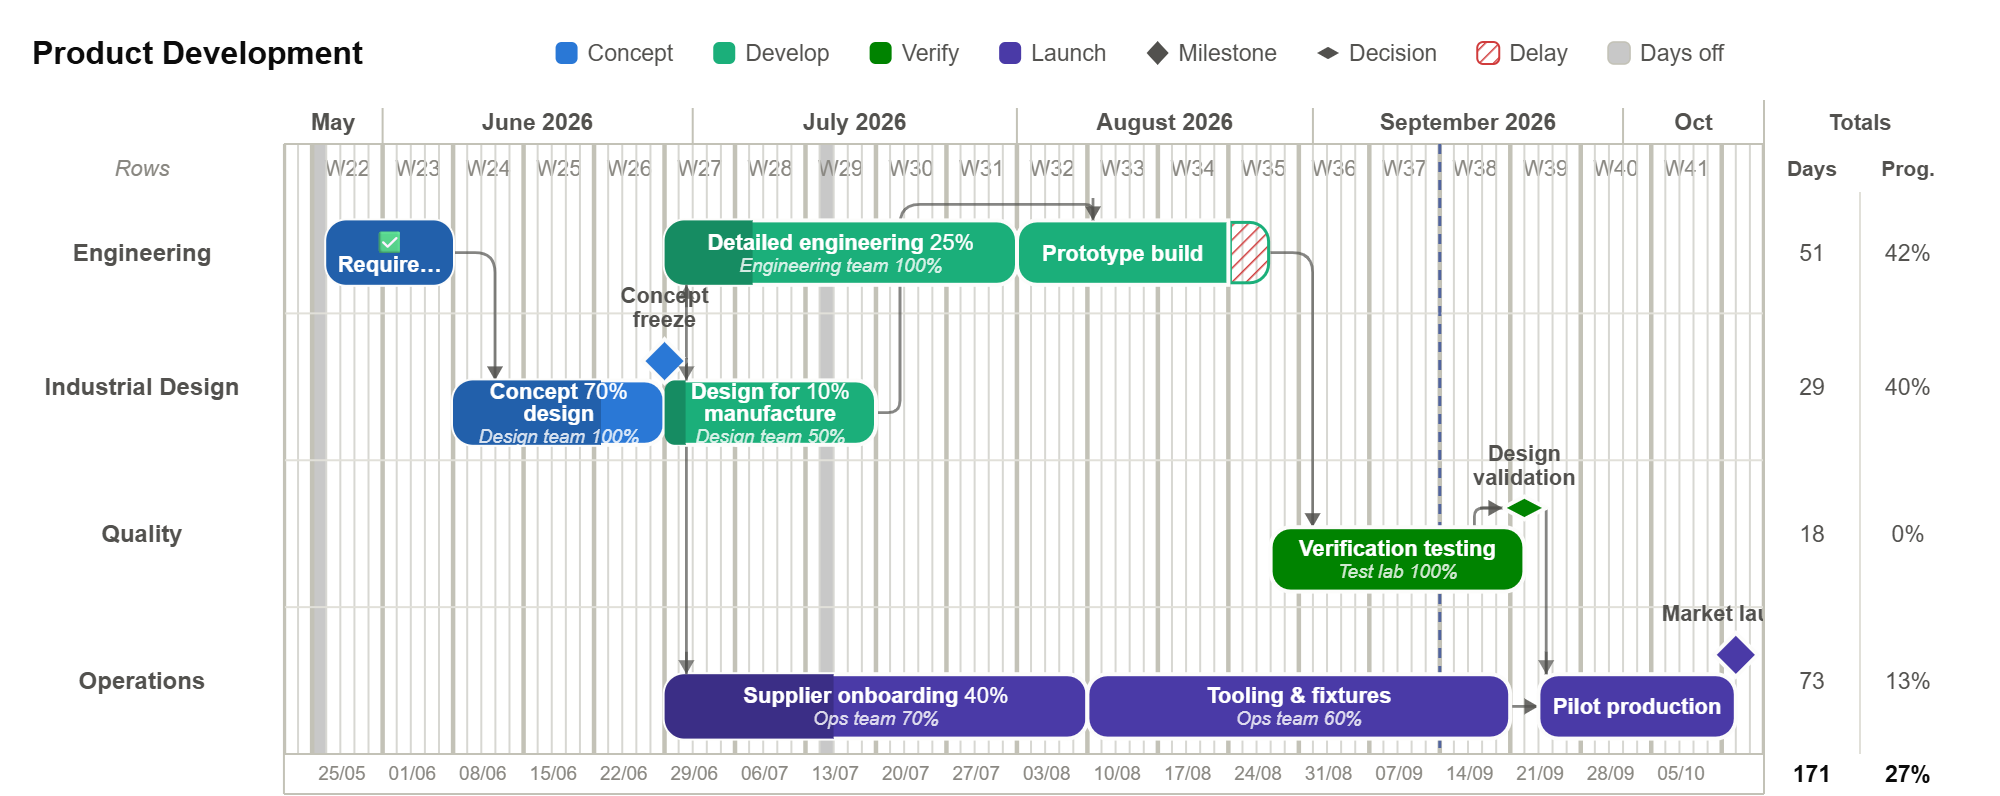
Why the screenshot looks bad
A screenshot is pixels at the size you captured them. PowerPoint then scales those pixels to the slide and a projector scales them again, so every edge is interpolated twice. Text suffers most, which is exactly the part of a Gantt chart people are trying to read from the back of the room.
Export vector instead
Use SVG from the export bar. PowerPoint has read SVG natively since Office 2016, and it stays vector: sharp at any size, on any projector.
Once it is on the slide you can right-click it and choose Convert to Shape. The chart becomes native PowerPoint shapes, which means you can restyle a bar to match your deck, or delete the legend, without coming back here.
If SVG is not an option
Export PNG instead and size the chart first — use Set px to make it about twice the width it will occupy on the slide, so there are enough pixels for the projector. PDF is vector as well and is the better choice if the chart is being printed or sent on rather than presented.
Keeping the slide current
Dates move. Re-exporting is one click, and because the plan lives here rather than in the deck, the chart on the slide can be replaced without rebuilding anything. The export always reflects what the plan says now.