 Project Timeline
← Back to the app
Project Timeline
← Back to the app
Free online Gantt chart maker
Free · opens in your browser · no sign-up
Last updated
Most “free” Gantt tools mean a trial, a row limit you hit on the second afternoon, or an export that stamps a logo across your chart. This one opens, works, and lets you take the picture away — without an account.
What free actually means here
The chart editor needs no account at all. Your work is kept in your browser, so you can close the tab and come back to it. You only sign in if you want the plan on another device, the AI assistant, or to share it.
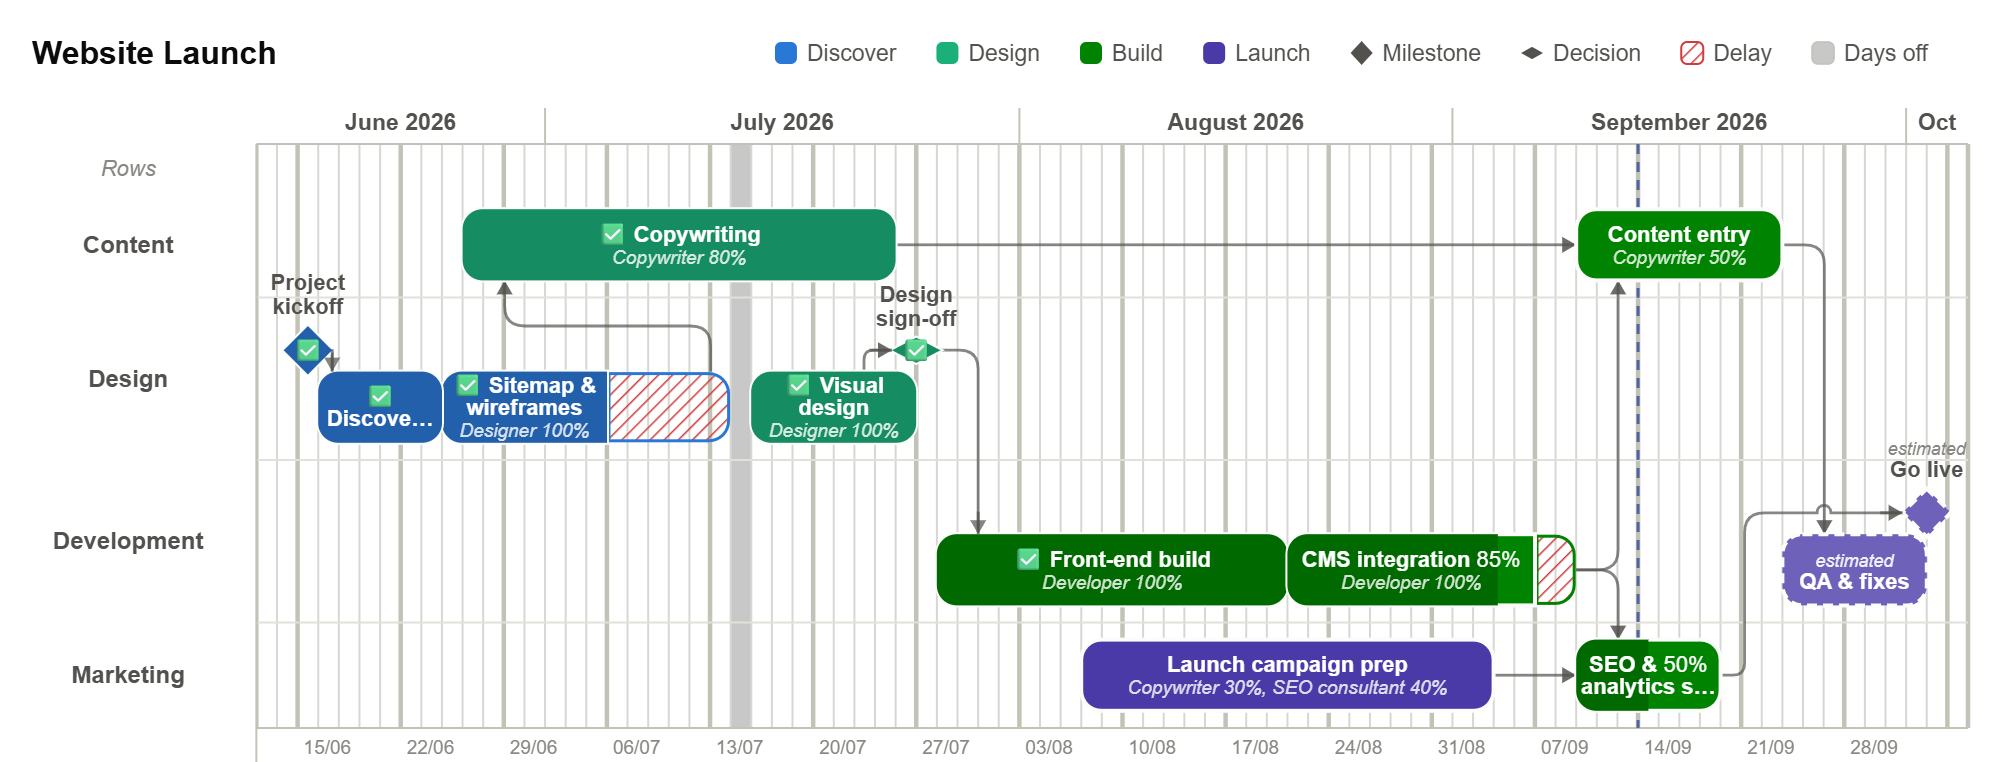
The free tier is a working tool rather than a demonstration of one: four chart rows, three resources, a ten-item data table, dependencies, the critical path, working calendars, and SVG, PNG, PDF and CSV export. The one visible limit is a small project-timeline.com mark in the corner of the chart. Nothing is time-limited and nothing expires.
Making the chart
The chart is the editor. Click an empty row to add a task, drag its ends to change the dates, and drag from one bar to another to link them. There is no form to fill in first and no separate grid to keep in step — what you see is the thing you are editing.
Because the links are real dependencies rather than drawn lines, moving one bar moves everything that waits on it. That is the part a spreadsheet cannot do, and it is the reason a Gantt chart is worth making at all.
Getting it out again
Export is SVG, PNG or PDF. SVG and PDF are vector, so the chart stays sharp when it is projected or zoomed — which matters more than it sounds like it should, because most Gantt charts are read on a wall or a screen share.
CSV import and export are there too, so a plan can start life in a spreadsheet someone else owns.
When you would want Pro
Pro raises the limits rather than unlocking the basics: 20 rows, 50 resources, a 100-item table, saved templates, palettes and calendars, project sharing, baselines, and the watermark off. It is €3.99/month or €34.99/year with a 14-day trial. If the free tier does what you need, it is meant to keep doing it.